Seeing the Clouds with the Cloud
03 Jun 2022 Tagged: meteorologyIf you follow AWS closely, you may have heard about a niche product launch a few years back called Ground Station which lets you rent, well, a ground station (basically a big antenna plus supporting equipment to communicate with satellites). A friend recently linked me an AWS blog post with a sample use case which described using it as a way of receiving real time imagery from orbiting weather satellites. Now funny enough, receiving data from polar orbiting weather satellites has been a side project of mine for over a decade now, but living in NYC has put a bit of a hold on it. I used to have a home-built QFH antenna which I used to receive images with a surprisingly high success rate given the janky construction of it.
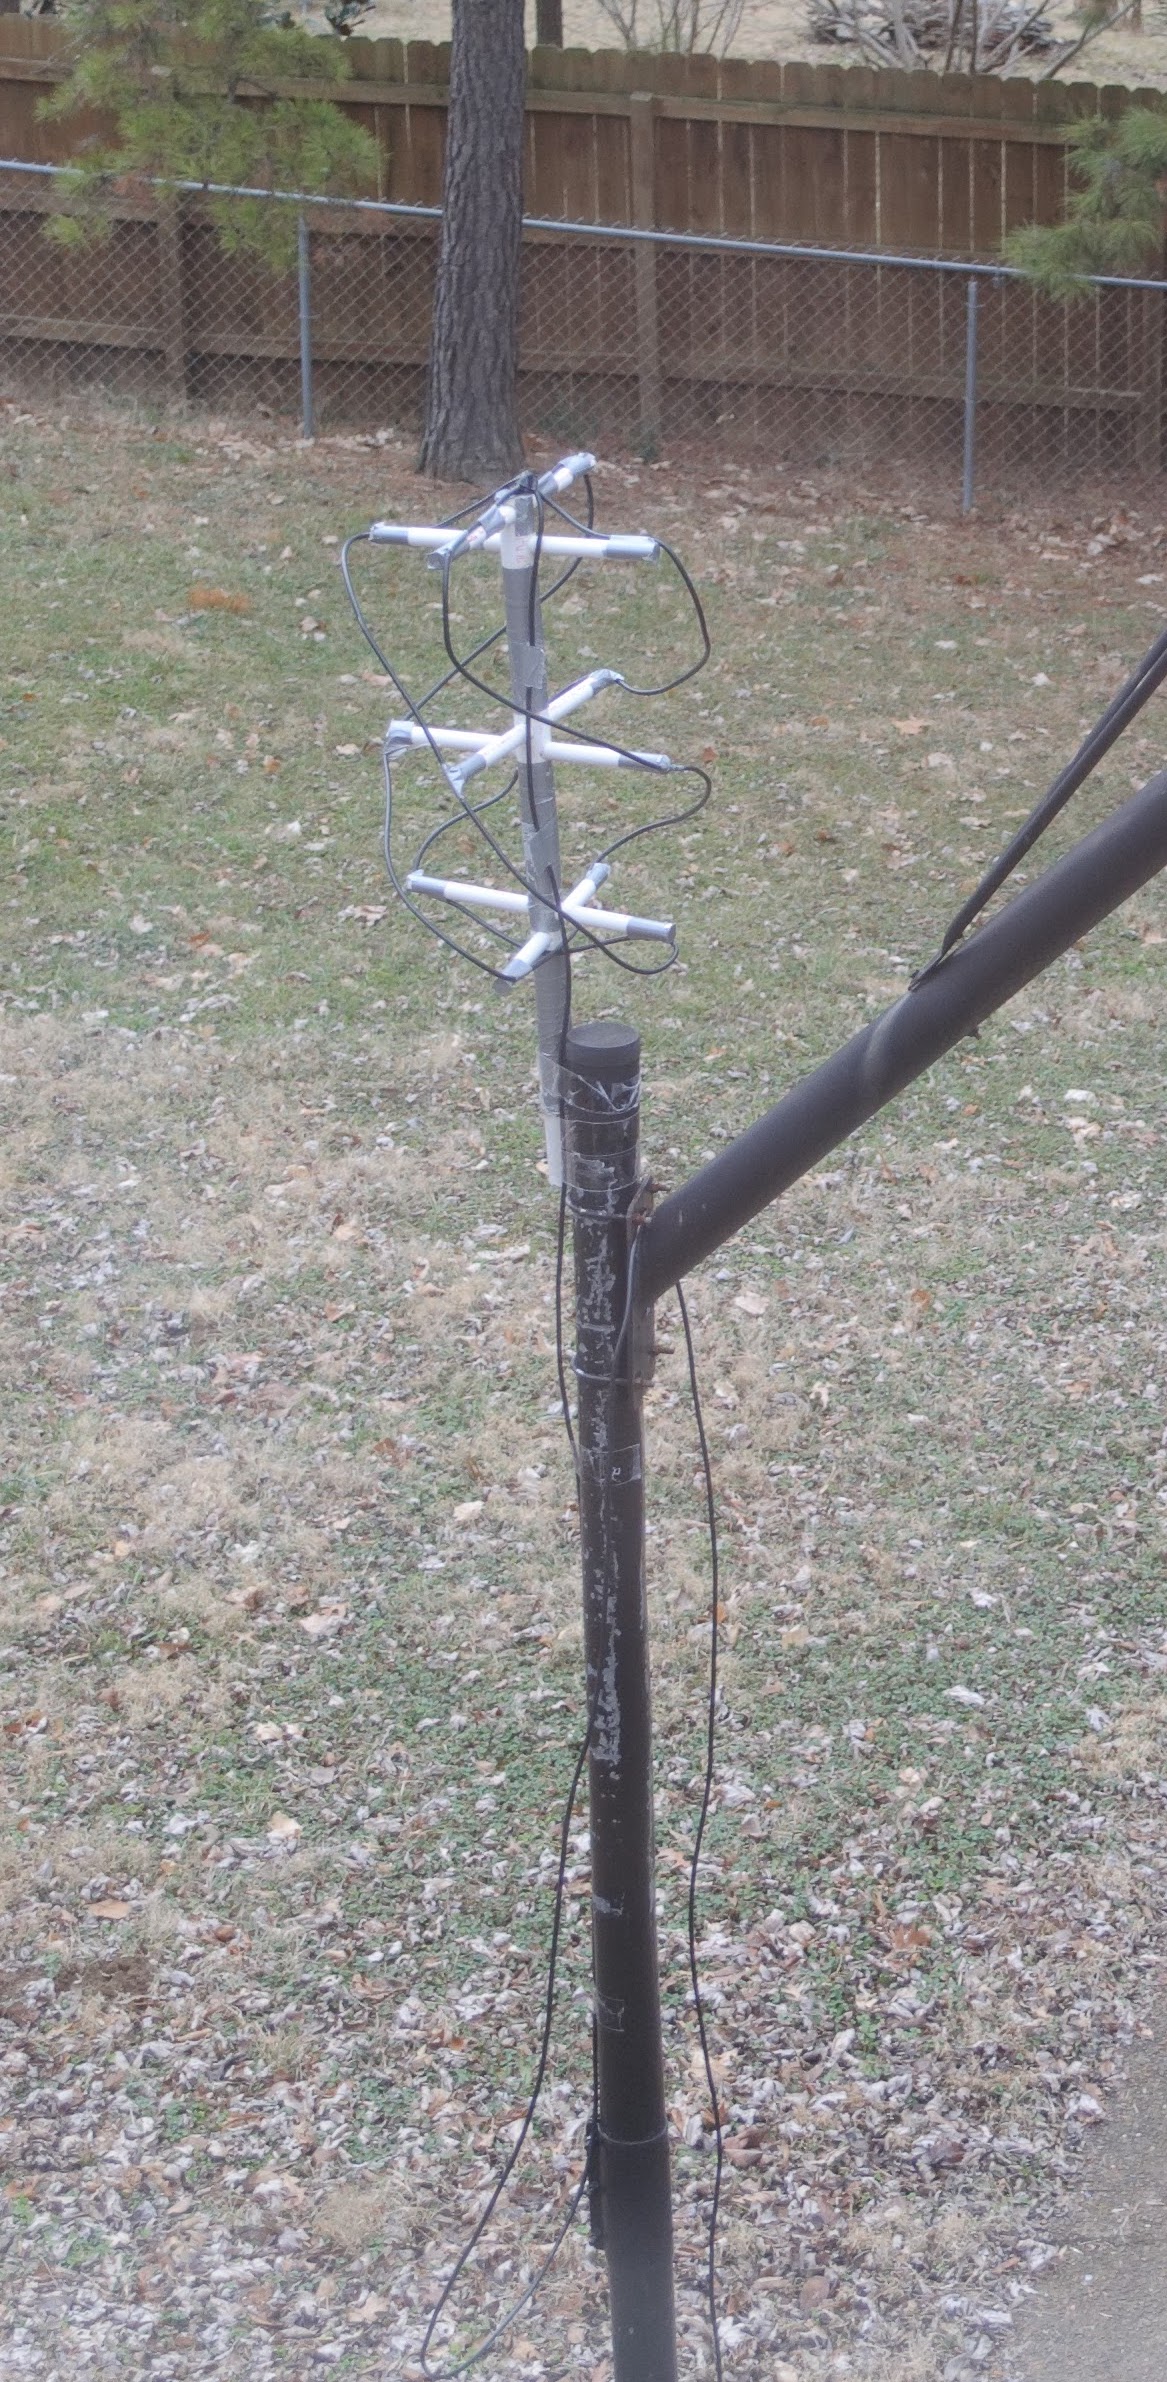
Yes, you’re seeing that correctly - it’s an antenna made of PVC tubing and coax duct-taped to the top of a pole for a basketball hoop. Crude but effective.
Anyways, the ability to use a remote antenna to downlink imagery piqued my interest, especially since these antennas would let me get the highest quality digital imagary sent out in the 8GHz X-band instead of the lower-quality analog APT transmissions around 137MHz that I had received in the past. So I set out to try and downlink a “true color” image.
I requested access to AWS ground station, but also found out about and filled out a request form to get access to Azure Orbital - Microsoft’s competing offering which is still in preview.
Onboarding
I never ended up hearing back from AWS after an initial email from them requesting details about my use case, however this is probably for the best as it costs $10/min to rent one of their antennas. With one pass of a polar orbiting satellite lasting anywhere from ~8-15 minutes, this would have gotten really expensive to be playing around on.
Since Azure Orbital was still in preview though, it was free to use! The Orbital team onboarded me to the preview quickly, however after a bit of back and forth trying to figure out why I was getting an error when a “contact” was supposed to start, I found out that they were only allowing downlinking from the NOAA AQUA satellite, not the weather-specific polar orbiting satellites (e.g. NOAA-20). This was fine though, as at the end of the day this was just an experiment and I had no need for the weather satellites in particular.
Trial and Error
While Azure was great about getting me on the platform, their docs were… lacking to say the least. It looks like they’ve added a small how-to guide in the months since I was experimenting which explains some of the questions I had, however it still doesn’t cover the last phase of actually demodulating and decoding the signal into usable data. It’s understandable since that’s not “relevant” to the service, but what good is it to receive data without doing something with it!
In case it helps anyone else though, I’ve put the questions I had and the answers the Orbital team gave back to me down below.
Data Ingest
Preface
Before diving in to details, I want to quickly go over the process for transforming radio signals into data, at least as it applies to receiving data from AQUA using Azure Orbital.
- RF data is received by an antenna, digitized, and transmitted over the network as a series of I/Q data encapsulated in “VITA-49” packets. These packets include the raw data as well as a bunch of other metadata from the receiving system (things like timestamps, receiver gain(s), configured intermediate frequency, etc.).
- The I/Q data is demodulated, in our case as a QPSK signal. This transforms the RF stream into one of four possible symbols.
- The demodulated symbols are then decoded into complete data frames. This is where the data is first interpreted (synchronizing to the start of frames).
- The frames are then checked for errors, the headers are parsed, and the frames are separated by the “virtual channel” (so data from multiple instruments can all share a common downlink and even be interleaved) then dispatched for processing.
There’s a lot to unpack in that if you’re new to this, but hopefully it helps make the rest of the blog at least a bit more understandable!
Receiving
As the Q&A at the end mentions, Orbital can do the demodulation and/or decoding for us, however the format for specifying how to do that is proprietary to a specific brand of modem (Kratos). Googling around a bit didn’t show any public documentation and I didn’t really feel like contacting them to try and get access to docs, so we’ll have to do this ourselves in software from the raw RF data.
First off, I setup socat on a small Azure VM to receive the data from the Orbital service and dump it to a file. I could have setup the listener on one of my personal machines, however given the bandwidth required to receive (~300Mbps) and the fact that I was on the opposite coast of the U.S., I opted to use a VM local to the Azure region the receiver was in to stage the data first.
$ socat TCP-LISTEN:1234,reuseaddr,fork 'SYSTEM:cat > raw-$(date +%s).dat'
After a pass, I manually uploaded the .dat file to object storage so that I could retrieve them later for processing on my machines at home.
Next, I needed to extract the raw data from the VITA-49 packets that Orbital actually sends. To do this, I wrote a Python script which parses the header of each packet (since the headers are variable length) and dumps the raw I/Q payload into a file since that’s all that matters for our purposes. This took a bit longer than you might think because the actual specification for VITA-49 costs a hundred dollars, and I hadn’t yet been pointed to the VITA-49 compatible (but free!) “Digital IF Interoperability Standard”.
Editors note: while trying to find the price for the VITA-49 spec again I ran across a draft of the spec which seems to cover everything. I guess my Google-fu was off…
The data extraction script can be found here
Demodulation
I started with a GNU Radio flowchart from the altillimity/X-Band-Decoders GitHub repo to demodulate the signal.
Aside: GNU Radio
GNU Radio is a open source software defined radio toolkit. It provides a ton of building blocks which can be chained together into flowcharts which implement any type of signal processing workload. For example, the flowchart used to do the demodulation looks like this:
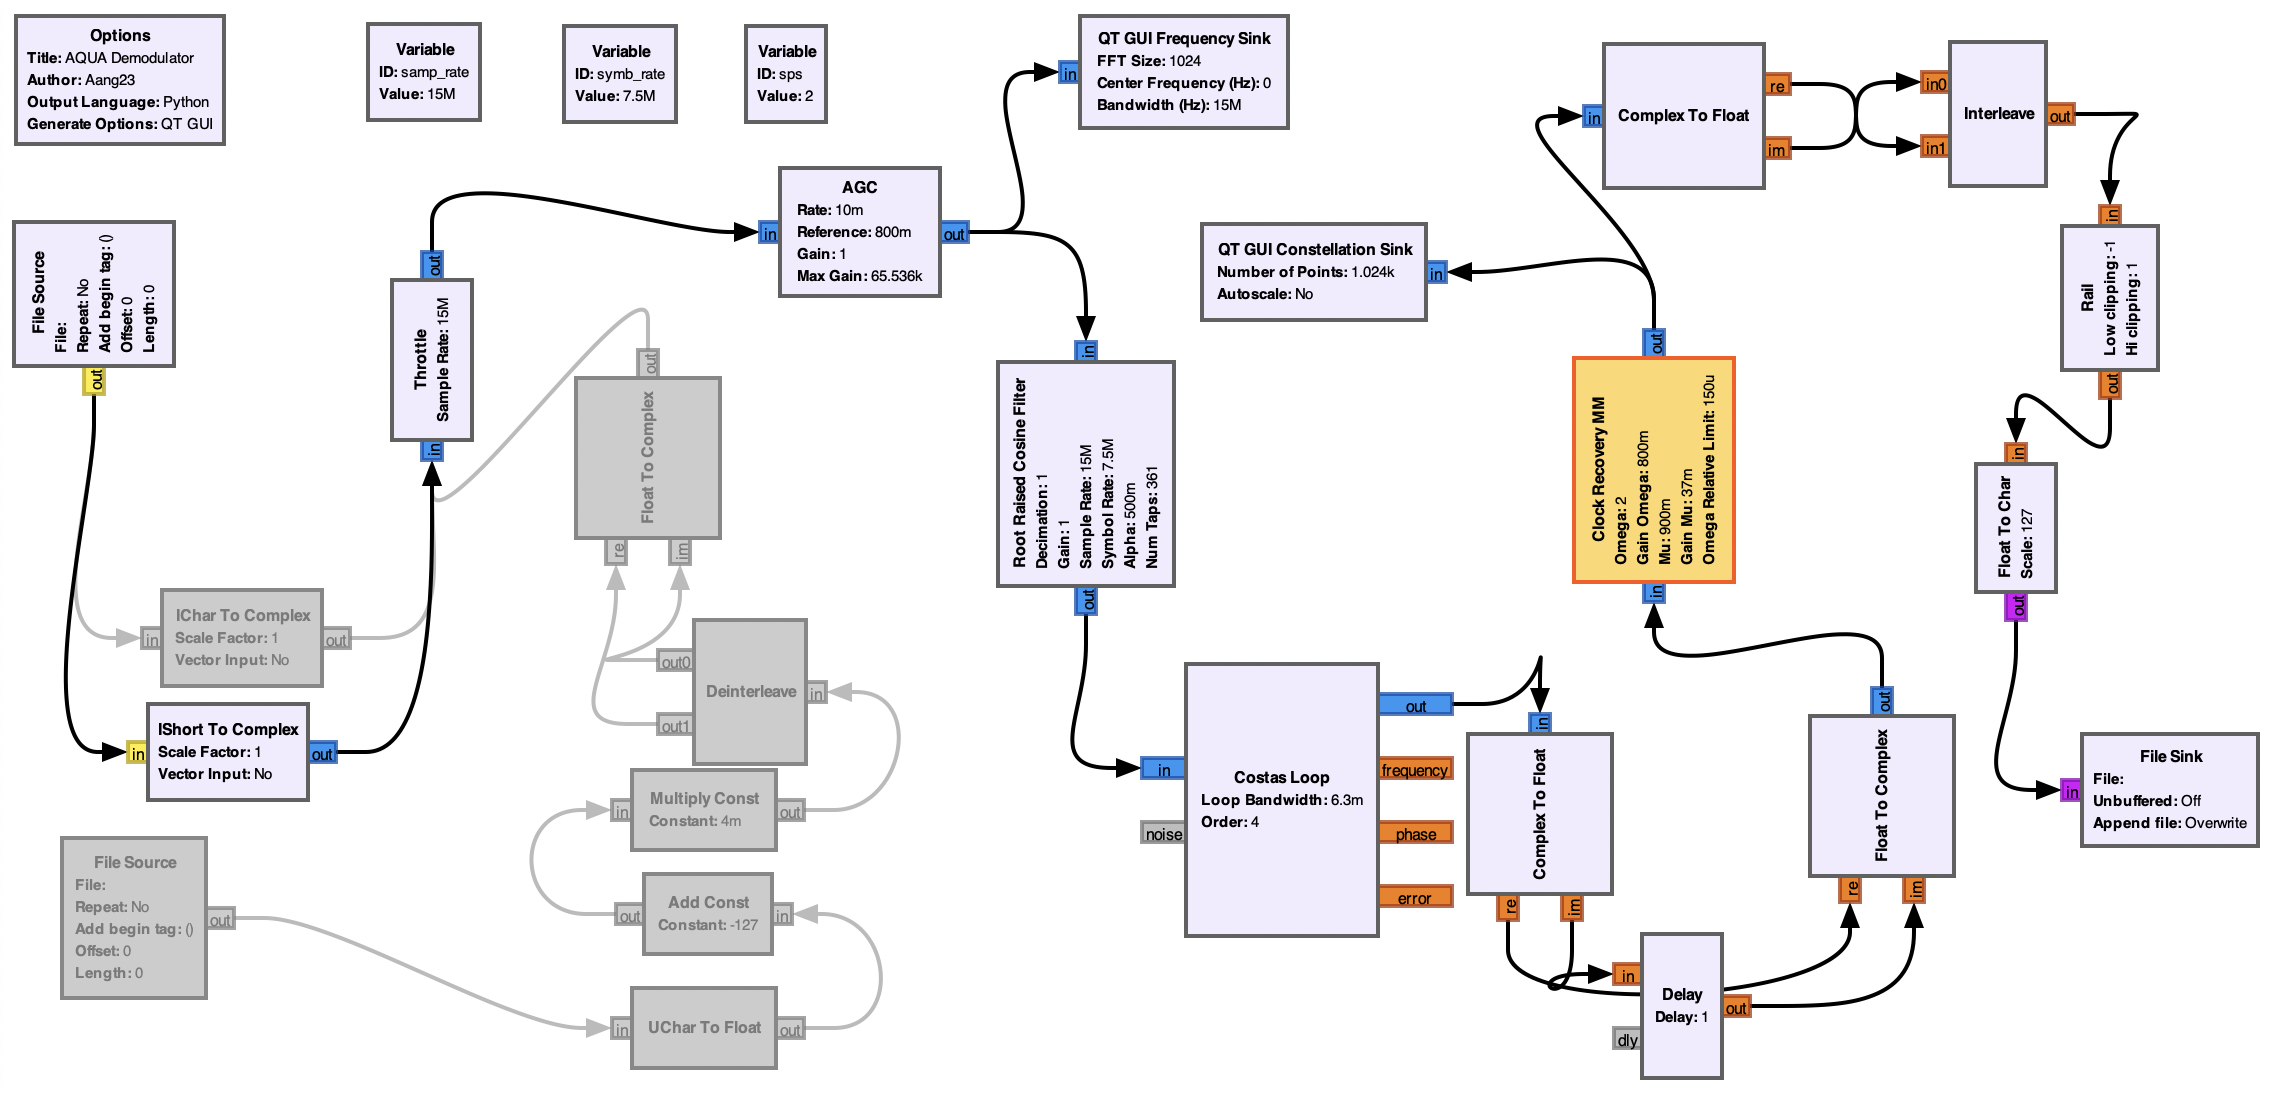
Don’t get me wrong, this looks very intimidating at first. I definitely still don’t understand all of it! However it’s worlds better than trying to piece together the code to do all of this signal processing yourself.
This was probably the most finicky part of the entire process. When running any GNU Radio chart on my M1 Macbook Pro (GRC version 3.9.3.0), the graphs didn’t update at all and it seems like the entire thing froze when first starting? After spending way too long thinking that was a bug in the chart and trying everything I could think of to make it work, I eventually ran it on my x86 Linux laptop and the graphs were updating and it seemed to be doing something.
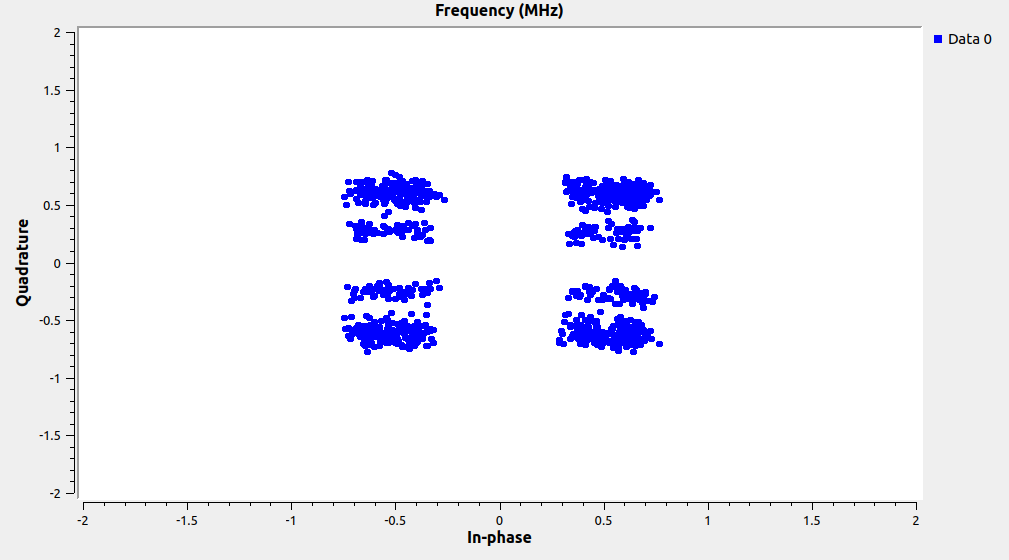
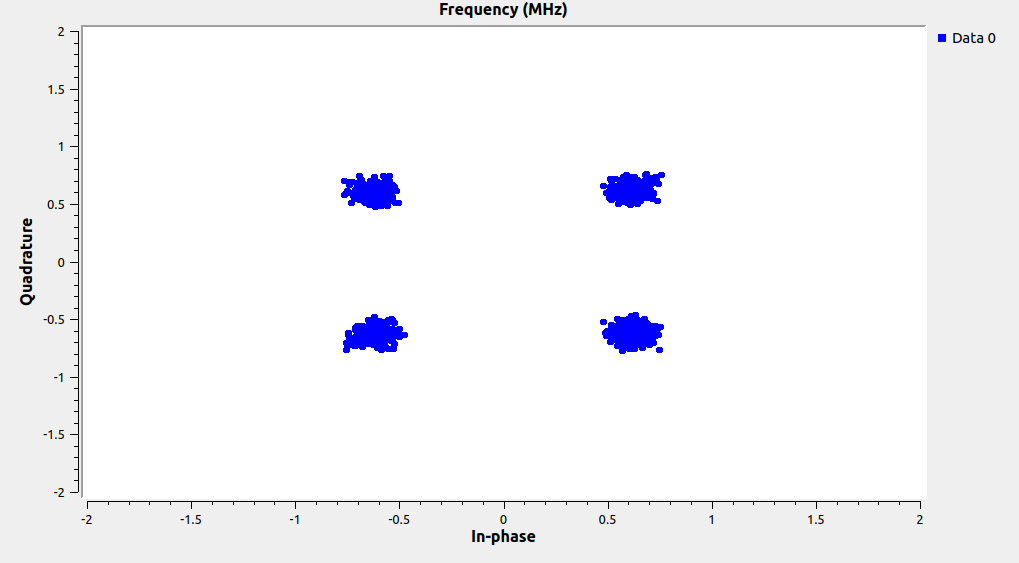
A few minutes in to processing (once the satellite was overhead) the frequency plot looked good:
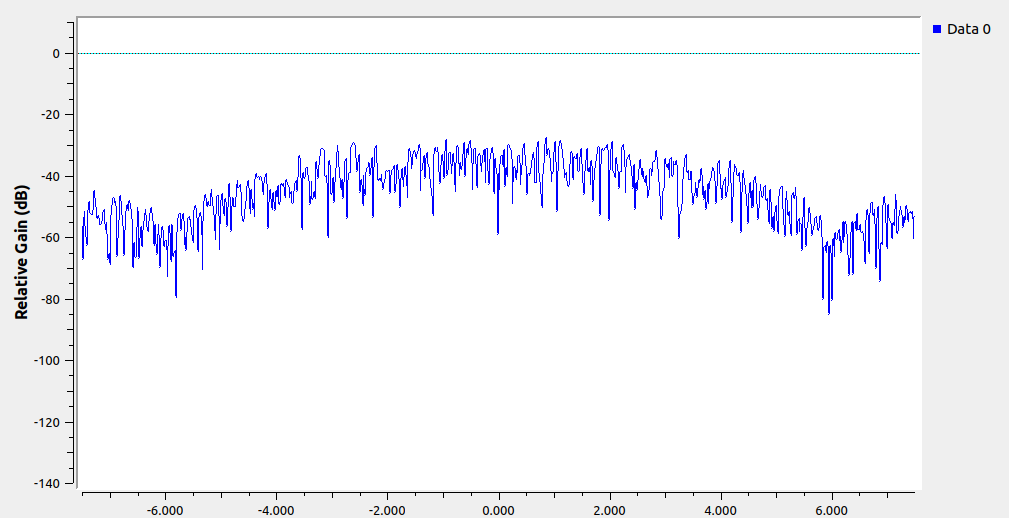
but the constellation plot had a weird “double image” and was showing eight clusters instead of the expected four (since this is QPSK). The demodulated data that was coming out was also not parsable by any tool I found - it seemed to be complete garbage.
Suspecting that this had something to do with clock recovery (matching the exact rate at which symbols are sampled to the rate the satellite is sending them out), I found a blog post after some Googling around that describes what the “Clock Recovery MM” block was actually doing under the hood. Applying the things talked about in that and tweaking the block parameters, I got slightly better output however it still wasn’t great. The decode tools were getting sync, but nearly every frame was corrupted. Finally, I saw on the “Clock Recovery MM” GNU Radio wiki page that that block was actually deprecated in favor of a new “Symbol Sync” block. I swapped that in and tried a few different algorithms, eventually settling on zero crossing which produced a great looking constellation and got the decode tools to start emitting uncorrupted frames.
The final flowchart is available here.
Decoding
Per the original AWS blog post, NASA’s RT-STPS toolkit is the “official” way to decode data from AQUA (and other) satellites. Unfortunately, despite it saying it got lock on the demodulated data, every frame it processed was “unroutable.” I dug into the source and eventually set a watchpoint where the satellite ID is extracted from the frame headers (the satellite ID being how it decides to route data), and the ID was all wrong. I’m still unsure why this was, but I didn’t want to spend much more time on it as the tooling in the aforementioned X-Band-Decoders repo already had decoding and data separation utilities for the MODIS data (which was all I needed to produce the simple true color image I was going for).
After waiting on a few dependencies to build, these tools worked first try yielding a stream of uncorrupted MODIS image data frames. Nice!
Rendering an Image
The X-Band-Decoders repo was once again helpful, pointing me to weathersat. As the README in the repo says,
If you don’t read this README with attention, as well as the
./hrpt.exe –help
output, you will (!!) fail to successfully run the s/w. Especially the environment variables described below are crucial !!!!
Promptly ignoring this, I spent an hour or so trying to get it to work to little avail.
Going back and looking at the output of --help though, there’s a nice example of how to use the utility to render a real color image from MODIS data - exactly what I wanted!
After stumbling over a couple last things (spaces in directory names breaking stuff and a missing trailing / in the necessary envvars), I had an image:
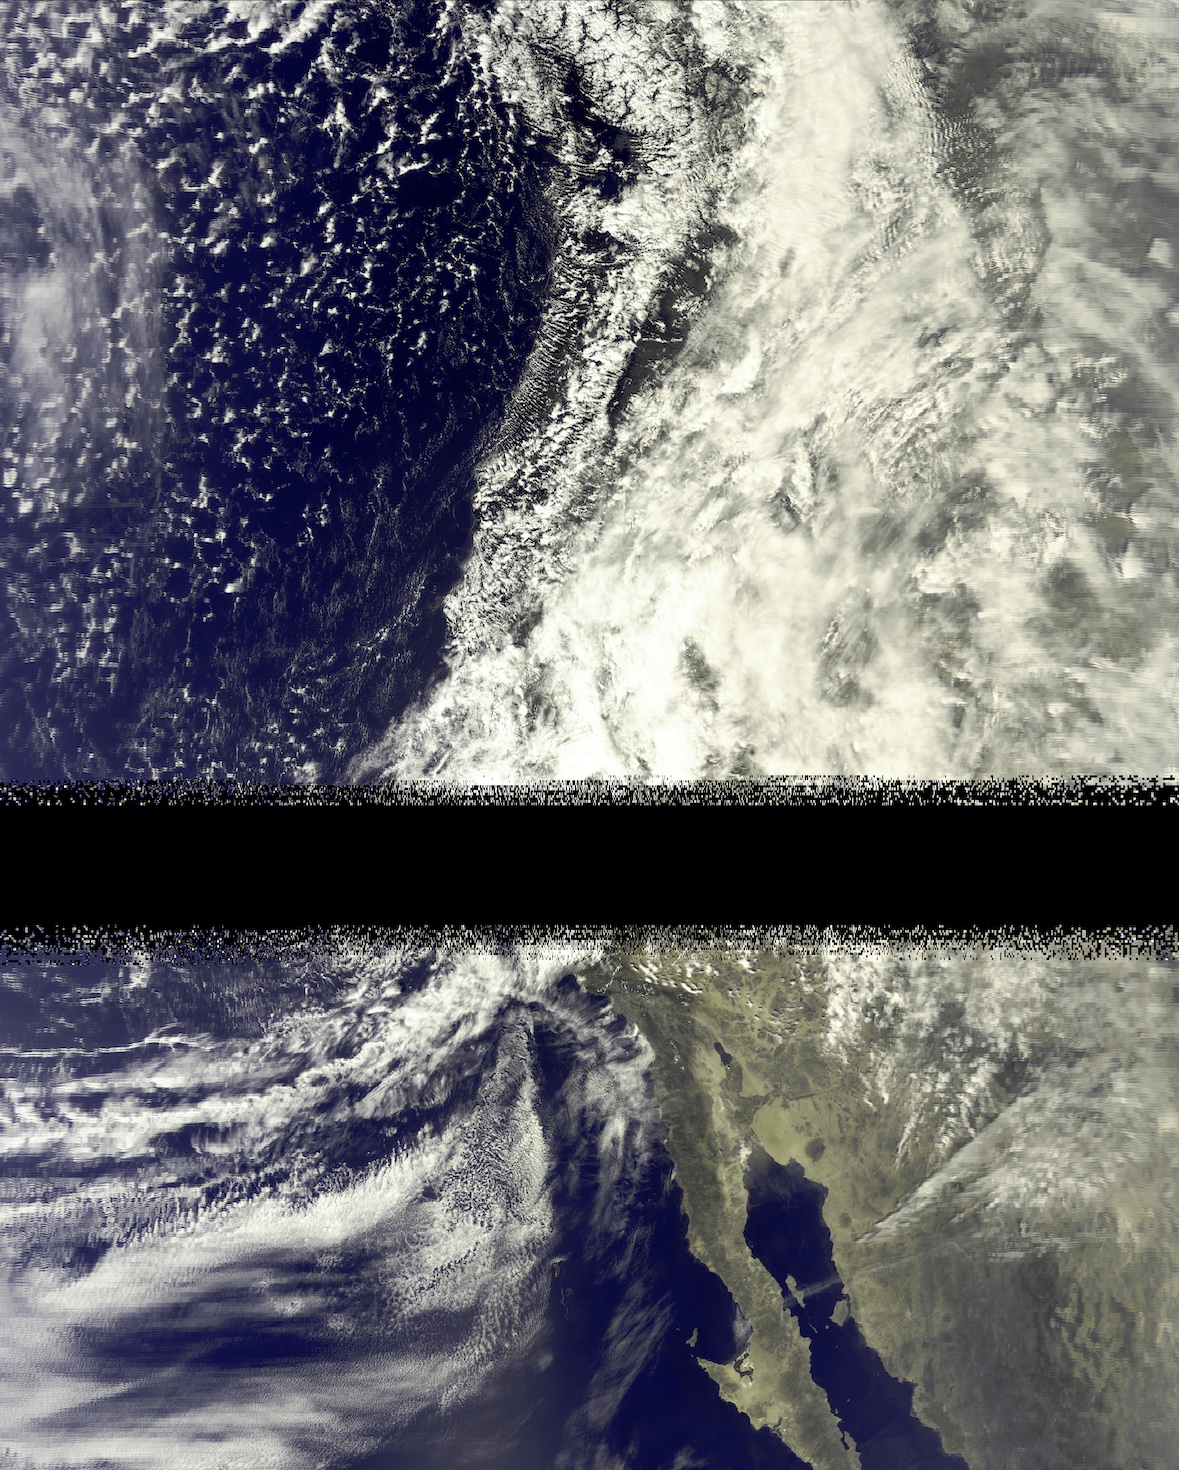
This process having taken a few days to perfect, I also had another capture ready to process. Running it through resulted in another pretty decent image:
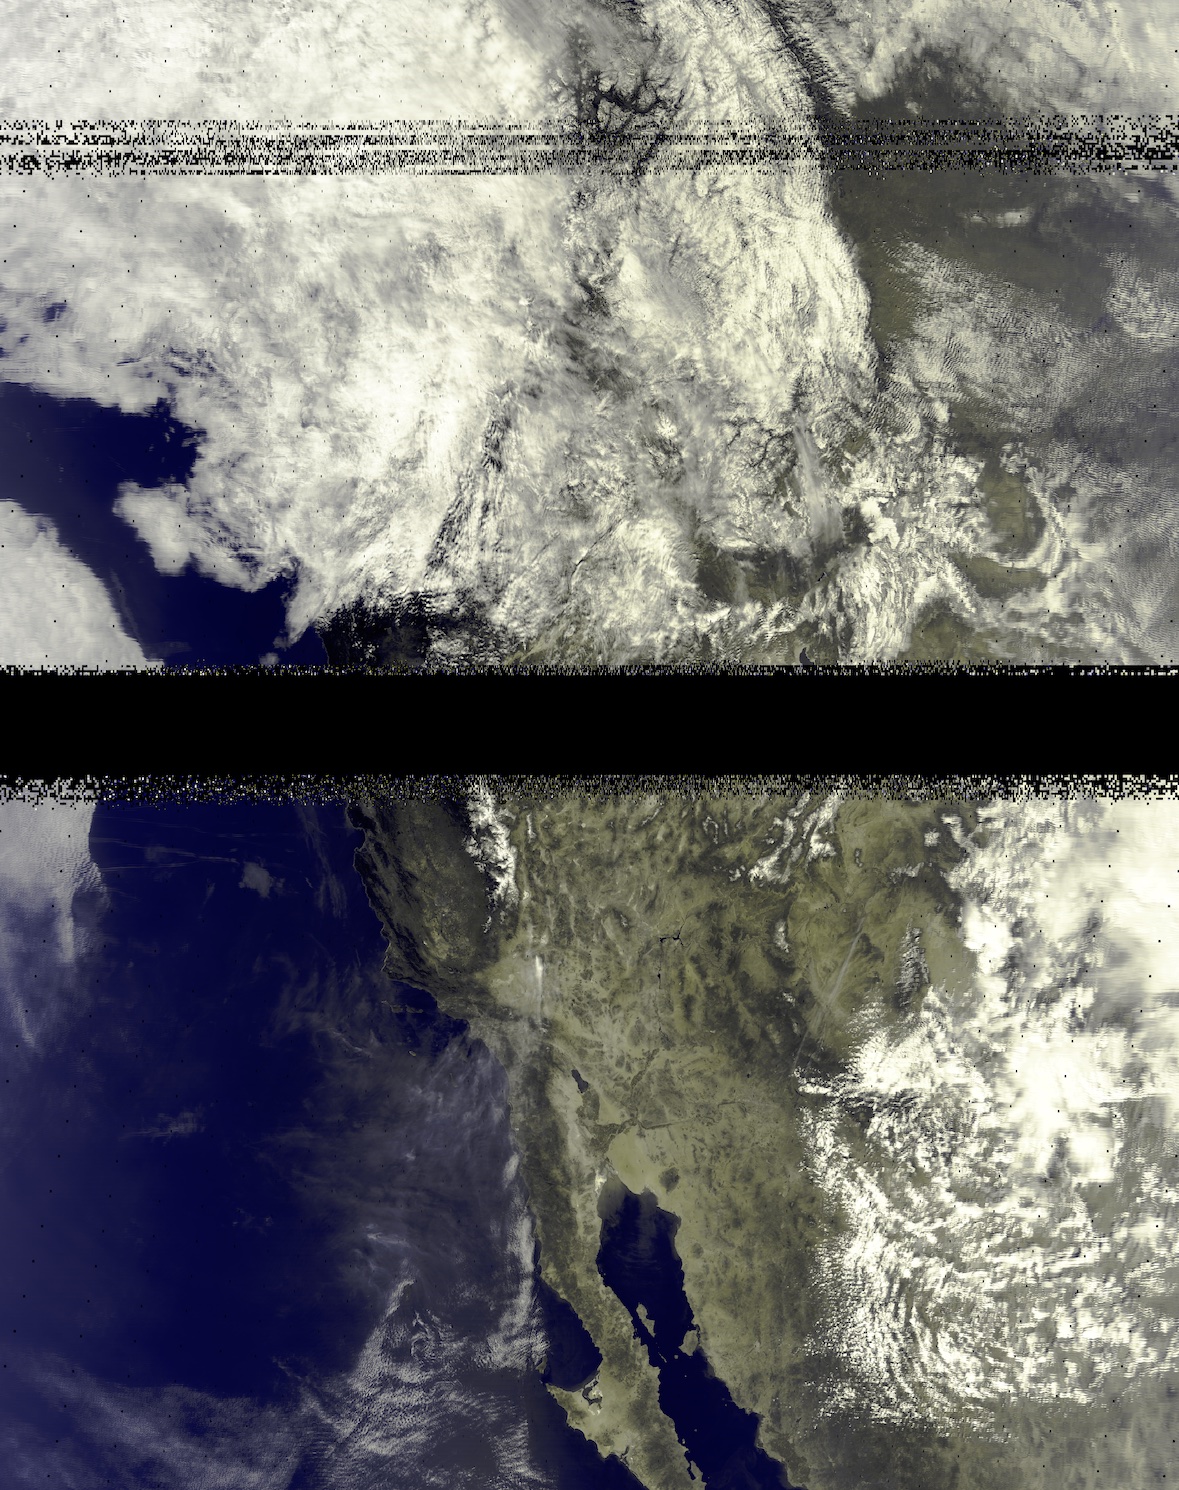
(For reference on what you’re seeing geographically speaking, the peninsula visible at the bottom of the images is Baja California)
Success!
Other Captures
I received data for a total of five AQUA passes (weighing in at ~100GB total!), however only two of them had usable data. I’m sure there’s more tweaking that could be done in the demod/decode steps which would probably yield more usable frames, but even the images I produced above have significant bands of little to no reception. As the images show, it was somewhat cloudy over the datacenter the antenna was located at (and these captures were all done within a few days of eachother), so perhaps the weather was interfering? Given that these are relatively high frequency signals (8.16GHz), I think atmospheric conditions could have an effect…
Either way, I got a couple cool images so I was very much content :)
Conclusion
This entire experiment occurred over the span of about two months from first requesting access to getting images out, but out of that span I only spent about three days actively working on it. Surprisingly quick for such a project I think!
All in all, it was quite a fun thing to spend some time on. I learned quite a bit more about software defined radio (hopefully you did as well!) and more than I would have ever liked to about VITA-49.
As always, feel free to reach out with any questions or feedback. I also still have the raw capture data if anyone would like a copy of it to experiment with the demod/decode/render steps themselves.
Appendix: Orbital Q&A
Q: What is the Gain/Temperature field? As far as I know this is normally a characteristic of the receiving system, not a tunable parameter?
A: The G/T field is a requirement passed by the user to the system. So you aren’t setting the G/T but rather requesting a min G/T spec. This is because Orbital integrates across many first party and partner sites with various antenna sizes. So if you needed a certain bar of performance when you query availability from site to site you can have that guarantee by specifying whatever G/T your link needs. We are not filtering on this yet in the near-term so feel free to put a placeholder value here.
Q: What is the format for the demodulation and decoding configuration?
A: The argument is an unvalidated blob or string type that is a copy/paste of the modem config file. Right now we offer Kratos modems in this mode.
Q: How is the data received actually encoded?
A: Azure Orbital leverages DIFI for its RF transport layer. Those details can be downloaded here at https://dificonsortium.org/, and Microsoft had a significant hand in the creation of this consortium. To that effect, our SDR team has released the GNU Radio Azure Software Radio toolbox publicly available on GitHub. This lets you interface directly with Orbital in GNU Radio without any need for manual coding or modding! All you have to do is specify your VM with this toolbox loaded as the endpoint. Check it out here: https://github.com/microsoft/azure-software-radio
N.B. The Azure Software Radio toolbox only supports reading data from a socket (doing all of the processing as it’s streaming in), or from a Azure blob storage file.
